
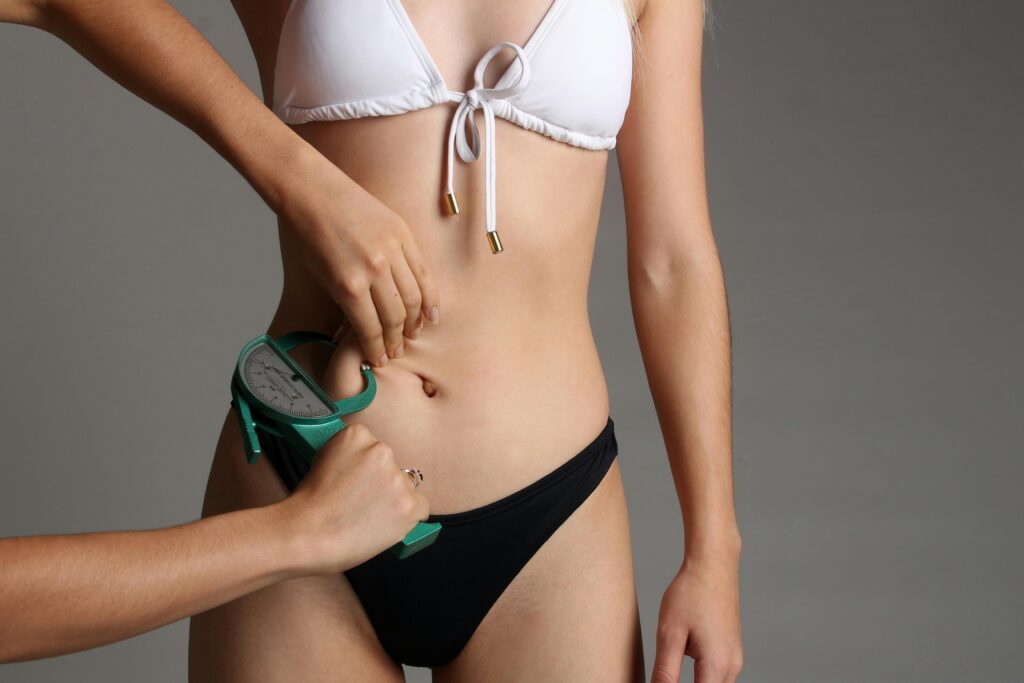
Your weight and BMI only tell part of the story. Body fat percentage — the proportion of your body that is made up of fat — is one of the most important and most overlooked measures of health and fitness. In this guide we follow Maya and Robin as they discover their body fat percentages, what the numbers mean, and what they did about it.
What is Body Fat Percentage?
Body fat percentage is the proportion of your total body weight that comes from fat tissue. For example if you weigh 80kg and have 30% body fat, that means 24kg of your body is fat and 56kg is lean mass — muscle, bone, organs, water, and other tissue.
Unlike BMI which only uses height and weight, body fat percentage actually tells you what your body is made of. Two people can have the same BMI but very different body compositions — and very different health risks.
Why Does Body Fat Percentage Matter?
Body fat percentage matters because excess body fat — particularly around the abdomen — is directly linked to serious health conditions including type 2 diabetes, heart disease, high blood pressure, and certain cancers.
What the research says: According to research published in the American Journal of Clinical Nutrition, excess body fat — particularly visceral fat stored around abdominal organs — is a stronger predictor of metabolic disease risk than BMI alone. Two individuals with identical BMIs can have dramatically different health outcomes based on their body fat percentage and distribution.
Source: Romero-Corral A, et al. Accuracy of body mass index in diagnosing obesity in the adult general population. International Journal of Obesity. 2008. NIH/PubMed.
What is a Healthy Body Fat Percentage?
Healthy body fat ranges differ significantly between men and women due to hormonal differences and the role of fat in reproductive function. Here are the widely accepted ranges used by fitness professionals and health organisations:
| Category | Men | Women |
|---|---|---|
| Essential Fat | 2–5% | 10–13% |
| Athlete | 6–13% | 14–20% |
| Fitness | 14–17% | 21–24% |
| Acceptable | 18–24% | 25–31% |
| Obese | 25%+ | 32%+ |
Source: American Council on Exercise (ACE) body fat percentage categories.
Maya’s Body Fat Percentage
Maya used our free Body Fat Calculator to estimate her body fat percentage. She entered her measurements — height 160cm, waist 92cm, neck 35cm, hip 105cm — and got her result.
Maya’s Results:
Estimated body fat: 42%
Fat mass: 33.6kg
Lean mass: 46.4kg
Category: Obese range
For women the healthy body fat range is 21–24% (fitness) to 25–31% (acceptable). Maya’s goal is to reach 28% body fat — which means losing approximately 18kg of fat while preserving her lean muscle mass.
Robin’s Body Fat Percentage
Robin also used the calculator. He entered his measurements — height 186cm, waist 78cm, neck 38cm — and got a very different result from what he expected.
Robin’s Results:
Estimated body fat: 11%
Fat mass: 6.6kg
Lean mass: 53.4kg
Category: Athlete range
Robin is actually in the athlete body fat range despite being underweight by BMI standards. This means his low weight is not because he has too much fat — it is because he simply does not have enough muscle mass. His goal is not fat loss but muscle gain.
BMI vs Body Fat Percentage — Which is Better?
This is one of the most important questions in health and fitness. Here is an honest comparison:
| Factor | BMI | Body Fat % |
|---|---|---|
| What it measures | Height to weight ratio | Actual fat proportion |
| Distinguishes muscle from fat | ❌ No | ✅ Yes |
| Ease of calculation | ✅ Very easy | ⚠️ Needs measurements |
| Accuracy for athletes | ❌ Poor | ✅ Good |
| Health risk prediction | ⚠️ Moderate | ✅ Strong |
| Best used for | Quick population screening | Personal health and fitness tracking |
The best approach is to use both together. BMI gives you a quick population-level snapshot. Body fat percentage gives you the personal detail. Used together they paint a complete picture.
How to Measure Body Fat Percentage
There are several methods available ranging from basic to highly advanced:
| Method | Accuracy | Cost | Notes |
|---|---|---|---|
| US Navy circumference method | ±3–4% | Free | Uses waist, neck, hip measurements — what our calculator uses |
| Smart body fat scale (BIA) | ±3–5% | $30–100 | Convenient for home tracking — less accurate but good for monitoring trends |
| Skinfold calipers | ±3–4% | $10–30 | Accurate when done by trained professional — less reliable for self-testing |
| DEXA scan | ±1–2% | $50–200 | Gold standard — most accurate, done at medical facilities |
| Hydrostatic weighing | ±1–2% | $50–150 | Very accurate — underwater weighing, available at sports facilities |
How to Reduce Body Fat Percentage
Reducing body fat requires a combination of calorie deficit, adequate protein, and resistance training. Here is what worked for Maya:
- Calorie deficit of 500 calories per day — Maya ate 1,492 calories per day, creating a sustainable deficit that led to fat loss without excessive muscle loss
- High protein intake — Maya aimed for 130g of protein per day to preserve her lean muscle mass during the deficit. Research shows protein intake of at least 1.6g per kg is essential during fat loss phases
- Strength training 3x per week — resistance training signals the body to preserve muscle even in a calorie deficit
- Daily walking — Maya added a 30 minute walk every day which increased her calorie burn without impacting recovery
- Tracking progress monthly — Maya recalculated her body fat every 4 weeks to monitor progress and adjust her plan
How Robin Improved His Body Composition
Robin’s goal was different — he did not need to lose fat but to build muscle to improve his overall body composition and move from the underweight category into healthy territory.
- Calorie surplus of 300 calories per day — Robin ate 2,884 calories per day, providing enough energy for muscle growth without excessive fat gain
- Very high protein intake — Robin targeted 150g of protein per day — 2.5g per kg of body weight — to maximise muscle protein synthesis
- Progressive overload training — Robin increased the weight or reps in his gym sessions every week to continuously challenge his muscles
- Adequate sleep — Robin prioritised 8 hours of sleep per night. Most muscle repair and growth hormone release occurs during deep sleep
Maya and Robin — 6 Months Later
Maya’s Progress
Starting body fat: 42%
Current body fat: 34%
Fat lost: 6.4kg of pure fat
Lean mass change: +1.2kg muscle
Maya is now in the acceptable range and approaching fitness range. She looks and feels significantly different despite the scale only showing 5kg of total weight loss — because she gained muscle while losing fat.
Robin’s Progress
Starting body fat: 11%
Current body fat: 13%
Muscle gained: 8kg of lean mass
Weight gained: 9kg total
Robin has moved from underweight to healthy weight. His body fat stayed low while his muscle mass increased dramatically. He is stronger, healthier, and his BMI is now 19.5 — solidly in the normal range.
Calculate Your Body Fat Percentage
Use our free Body Fat Calculator — just enter your height, waist, neck and hip measurements for an instant estimate. Supports both metric and imperial units.
Calculate My Body Fat Free →The Bottom Line
Body fat percentage is one of the most meaningful measures of your health and fitness. Maya’s story shows that even with a high BMI you can track and reduce body fat systematically. Robin’s story shows that a low BMI does not mean low body fat is the problem — sometimes the issue is simply not enough muscle.
Use body fat percentage alongside BMI for the most complete picture of your health. Together they tell you not just how much you weigh — but what your body is actually made of.
References
- Romero-Corral A, et al. Accuracy of body mass index in diagnosing obesity in the adult general population. International Journal of Obesity. 2008. NIH/PubMed.
- American Council on Exercise (ACE). ACE Lifestyle & Weight Management Coach Manual. 2012.
- Stults-Kolehmainen MA, et al. The relationship between body fat and physical fitness in male collegiate athletes. Journal of Strength and Conditioning Research. 2010.
- Wu G. Dietary protein intake and human health. Food & Function. 2016. NIH/PubMed.
📖 Related Articles
Disclaimer: Maya and Robin are fictional characters created for educational purposes. This article is for informational purposes only and does not constitute medical advice. Always consult a qualified healthcare professional for personal health guidance.